By Dirk Euhus and Dr. Tobias Fürtjes,
D. Euhus is MMS Research Manager at MARPOSS / ARTIS and MMS project leader at Twin-Control
T. Fürtjes is MMS Research Project Manager at MARPOSS / ARTIS and task leader at Twin-Control
Monitoring infrastructure
A reliable and continuous monitoring of all use case machines is one of the most important task in Twin-Control. Overall, in Twin-Control six industrial use case machines (three at Renault, three at MASA), three laboratory use case machines (TU Darmstadt, TEKNIKER, ARTIS) and three Pilot-line use case machines (ETA Factory Darmstadt, Factory of the Future Sheffield, Basque AMC Bilbao) should be equipped with MARPOSS / ARTIS monitoring hard- and software. In this way, Twin-Control provide a 24/7 cloud-based monitoring for fleet level process analysis as well as for analysis across different machine-tools, factories, processes, products and countries.
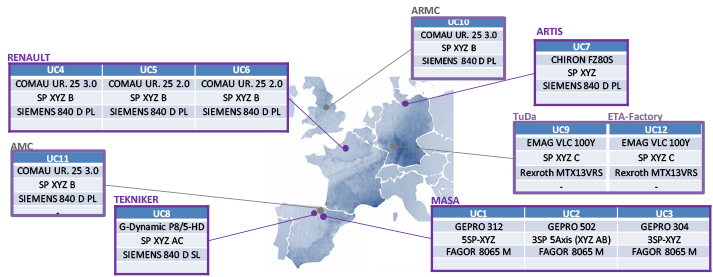
Today, all industrial and laboratory use case machines as well as the ETA Factory pilot line use case machine are completely equipped with MARPOSS / ARTIS condition and process monitoring hardware. The installation of the two-remaining pilot line use case machines is scheduled for 2017 (see Figure 1).
For each use case machine a basic configuration was chosen, which covers the most significant process information:
Genior Modular: Basic device, which monitors real-time data from the machine control and receive and process the real-time data from the additional devices. In the Genior Modular device alarm signals, process limits, machine instructions etc. could be configured.
- OPR: Offline Process Recorder, which is a prototype unit working as a local intelligent storage isle, providing the connection to the cloud platform and allowing local process analysis based on the statistical R program.
- TP-Modul: True Power Module, which provides the total machine true power (with additional hall-sensors) in real-time.
- VM-Modul: Vibration Module, which provides acceleration and velocity signals of connected acceleration sensors in real-time.
- GEM-VISU: Visualization software, which could be installed at the machine control, PC or mobile devices. The GEM-VISU allows an intuitive overview about the ongoing and past processes and will serve as framework for the Twin-Control shopfloor HMI. Furthermore, through the Multiview function it is possible, to analyze more machines at the same time in one display.
Beside this standard configuration, further devices and applications were installed to support the individual research tasks. For example, for the Characterization test at TEKNIKER, a special version of the VM-Module was investigated, which provides sample rates of up to 25 kHz for improved vibration analysis. The OPC UA interface is another example of individual prototype configuration at the use case at TU-Darmstadt, which allows the monitoring of non-real control signals of Bosch Rexroth controls.
Cloud-based fleet monitoring
The main objective of Twin-Control is the development of a simulation and control system that integrates the different aspects that affect machine tool and machining performance. This holistic approach will allow a better estimation of machining performance than single featured simulation packages, including lifecycle concepts like energy consumption and end-life of components.
From Twin-Control point of view, fleet refers to a set of machine tools of different owners and builders. Fleet’s units must share some characteristics that enable to group them together according to a specific purpose. Fleet management raises issues such as how to process large amount of heterogeneous monitored data (i.e. interpretable health indicator assessment), how to facilitate diagnostics and prognostics of heterogeneous fleet of equipment (i.e. several technologies and usage), how to provide key users with an efficient support to decision-making throughout the whole asset lifecycle.
All collected, computed and extracted information by the platform will be stored in the Knowledge Base (KB). For each machine tools, expected inputs of the fleet platform can be classified in two groups:
- Automatic inputs that are regularly pushed to the fleet platform by the MARPOSS systems:
- Collected data acquired directly from the machine tools with high and low sampling rate.
- Local processing information computed locally in the MARPOSS systems (energy monitoring).
- Alarms generated by both CNC of the machines tools and MARPOSS monitoring units.
- Manual inputs that are entered or uploaded by users:
- Characterization tests: test result files and/or additional collected data from mobile equipment can be uploaded on the platform via a specific HMI.
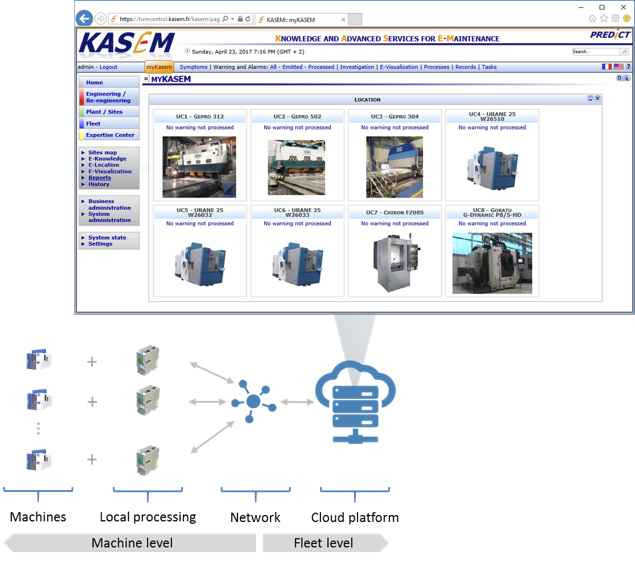
As basic part of this Knowledge Base, a cloud-based platform for all relevant process data was investigated, which allows the generation of intuitive and individual reports as well as the computing of advanced model-based analysis and correlation of various information. This fleet platform is for all use cases except Renault in the “cloud”, i.e. on internet, and hosted to a PREDICT secure server. For industrial use case, an additional local PREDICT server was installed, which transfers the data to the cloud solution. This solution is based on KASEM® (Knowledge and Advanced Services for E-Maintenance) software a PREDICT Tool for Prognostics and Health Management (see Figure 2).
The OPR push real-time and non-real-time data to the cloud service hosting the Kasem® solution to feed the knowledge base. Inside Kasem® there are different services able to read binary information as time series. Regarding transfer protocols, secure WebDAV is default option as upload stream. Once internet connection is up and running, it is possible to download a report from the OPR module (download stream) or from the Genior Modular HMI Plugin.
The amount of data stored at the KASEM platform depends on the use case configuration. First, the sample frequency of the monitored data influenced the amount of data. In general, real-time data are monitored and stored with a sample frequency of 2-10 milliseconds. Non-real-time signals are monitored and stored with sample frequencies between 1 and 8 seconds. Second, the number of monitored signals must be considered to estimate the overall data traffic. Due to the fact, that each of the 7 use cases comes with an individual signal configuration, it is not possible to calculate a universally valid value. For example, in Renault und MASA use cases the OPR runs in batch mode and pushes the data to KASEM each 5-10 minutes resulting in 600 GB in total in the case of Renault and 1,120 GB in the case of MASA per machine per year.
Visualization of fleet and cloud-data at machine level
Twin-Control shopfloor HMI is the basic human-machine interface for monitoring and control being fully integrated in all use case machine tool control screens.
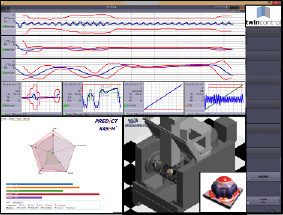
In fact, it is the MARPOSS / ARTIS Genior Modular VISU (GEM-VISU), which allows a comfortable way to display all relevant process information.
For Twin-Control the GEM-VISU is expanded with the addition of several Plug-Ins. This way, the Twin- Control shopfloor HMI at the machine tool integrates different module results (see Figure 3):
- Genior Modular: Data acquisition, local monitoring and control
- Kasem®: Remote Fleet based knowledge
- NC Simulation: Integration of Modulworks simulation tool
- OPR: Machine learning results as web pages, like basic RUL estimation
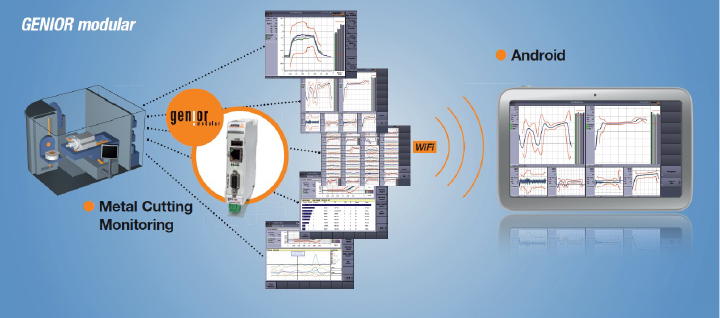
To provide the relevant information regardless of the location, a multiview-function was integrated. This function allows displaying the monitoring data of each connected machine-tool at one display. In terms of industry 4.0, smart devices come more and more in focus. Due to this fact, also a prototype GEM-VISU for Android OS was developed (see Figure 4).
With the successful monitoring of all use case machines the perfect initial situation is provided for starting the integration of the novel and innovative model-based control strategies of Twin-Control.
